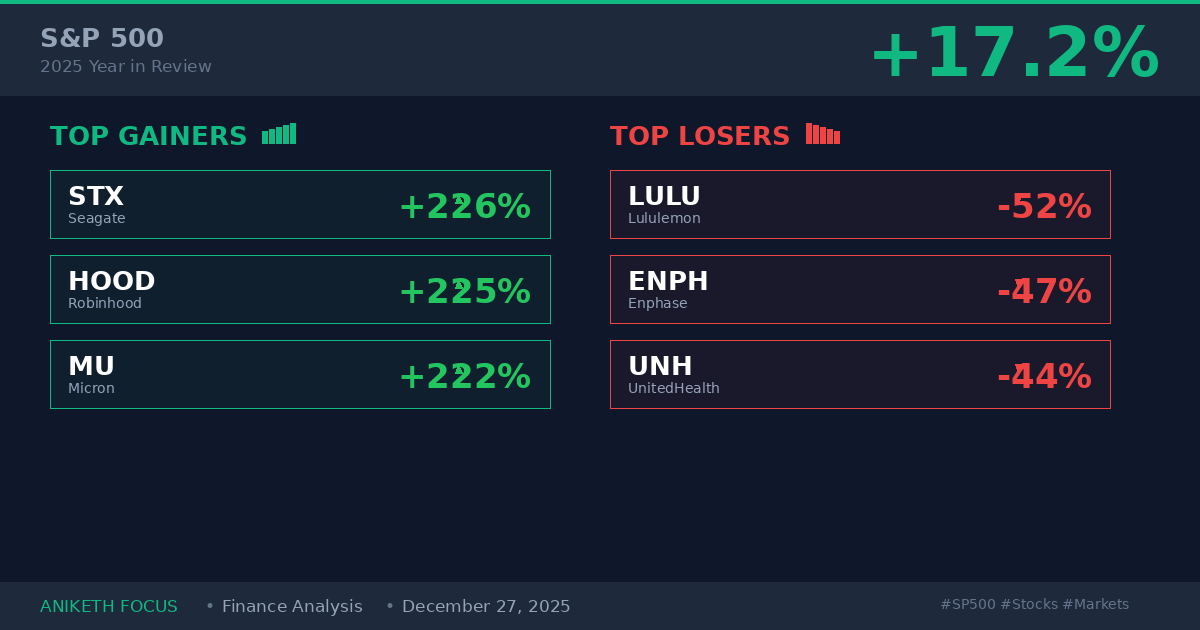
The S&P 500 delivered a solid 17% return in 2025, but beneath this aggregate performance lies extraordinary divergence. While the index tracked close to historical averages, individual stocks experienced outcomes ranging from spectacular gains exceeding 200% to devastating losses approaching 50%. Understanding why certain companies thrived while others collapsed provides critical insight into market dynamics, valuation discipline, and the fundamental factors that separate enduring winners from value traps.
This analysis examines the top five gainers and five most devastating losers in the S&P 500 during 2025, conducting fundamental analysis on each stock to identify the economic drivers, business model strengths or weaknesses, and valuation dynamics that determined their trajectories. For students preparing for finance careers and professionals seeking to sharpen their analytical skills, these case studies demonstrate how fundamental analysis—examining revenue growth, profitability metrics, competitive positioning, and market conditions—provides superior insight compared to technical analysis or momentum trading alone.
Part I: The Spectacular Winners—How Five Stocks Delivered 200%+ Returns
The top-performing stocks in 2025 shared common characteristics: exposure to structural growth trends (artificial intelligence, data infrastructure), improving fundamental metrics (accelerating revenue growth, expanding margins), and business models positioned to benefit from multi-year secular tailwinds. Each winner demonstrated that exceptional returns stem from fundamental business strength rather than speculation.
1. Seagate Technology (STX): +226% YTD—Data storage infrastructure riding the AI wave
Seagate Technology emerged as one of 2025’s most unexpected winners, surging 226% as artificial intelligence infrastructure demands created unprecedented need for mass data storage capacity. Based in Fremont, California, Seagate manufactures hard disk drives (HDDs) and solid-state drives (SSDs) for personal computing, data centers, gaming, and enterprise storage applications.
The fundamental drivers: AI infrastructure creating storage supply shortage
Seagate’s extraordinary performance stemmed from a fundamental supply-demand imbalance. Large language model training requires storing massive datasets—often measured in petabytes—creating unprecedented demand for high-capacity, cost-efficient storage. Hard disk drives, which Seagate specializes in manufacturing, offer storage capacity at significantly lower cost per terabyte compared to solid-state alternatives, making them essential for AI data infrastructure.
The market experienced a genuine shortage of memory and storage products throughout 2025. Cloud hyperscalers—Amazon Web Services, Microsoft Azure, Google Cloud Platform—competed aggressively to secure storage capacity for AI training clusters. This scarcity environment allowed Seagate to command premium pricing while maintaining production at maximum capacity. Revenue growth accelerated quarter-over-quarter as enterprise customers placed multi-year contracts to secure supply.
Investment lesson: Identifying supply-constrained beneficiaries of secular trends
Seagate demonstrates a critical investment principle: the most profitable opportunities often exist not in the headline technology itself (AI models), but in the infrastructure enabling that technology (data storage). Investors who identified AI’s secondary effects—massive storage requirements, power infrastructure needs, cooling system demands—captured returns that rivaled or exceeded direct AI investments. This analytical approach—identifying supply-constrained inputs to major trends—represents a fundamental analysis skill with consistent application across market cycles.
2. Robinhood Markets (HOOD): +225% YTD—Retail trading renaissance powered by crypto
Robinhood Markets, the Menlo Park-based discount brokerage platform, surged 225% in 2025 as two powerful forces converged: resurgent retail investor activity and explosive cryptocurrency trading volume. The platform, which offers commission-free trading of stocks, ETFs, options, and cryptocurrencies, experienced dramatic user growth and engagement increases throughout the year.
Revenue model: Payment for order flow and interest income acceleration
Robinhood’s business model generates revenue through payment for order flow (PFOF)—market makers pay Robinhood for routing customer orders to them—plus interest earned on customer cash deposits and cryptocurrency trading fees. The 2025 cryptocurrency bull market, driven by Bitcoin’s surge past $100,000 and regulatory clarity under new SEC leadership, created extraordinary trading activity. Crypto transaction revenue grew triple digits year-over-year as retail investors actively traded digital assets.
Simultaneously, elevated interest rates allowed Robinhood to earn substantial income from investing customer cash balances. With the Federal Reserve maintaining rates in the 4-5% range throughout most of 2025, Robinhood generated significant net interest income—a revenue stream that proved more stable and profitable than transaction-based revenues alone. This diversified revenue model provided downside protection while cryptocurrency volatility created upside optionality.
Investment lesson: Understanding cyclical vs. structural revenue streams
Robinhood’s performance highlights the importance of distinguishing cyclical revenue surges from structural business improvements. Cryptocurrency trading revenue is inherently cyclical—dependent on market volatility and retail investor enthusiasm. In contrast, assets under custody and net interest margin represent more durable revenue streams. Investors who recognized that Robinhood was building structural advantages (growing user base, expanding product offerings, regulatory normalization) while benefiting from cyclical tailwinds (crypto bull market) captured the full gain. Those who viewed it purely as a crypto trade likely exited too early.
3. Micron Technology (MU): +222% YTD—Memory chips powering AI acceleration
Micron Technology, the Boise, Idaho-based memory and storage manufacturer, gained 222% in 2025 as artificial intelligence applications drove unprecedented demand for high-bandwidth memory (HBM) chips essential for AI processing. The company produces DRAM (dynamic random-access memory) and NAND flash memory products serving data centers, mobile devices, automotive systems, and industrial applications.
The HBM revolution: Memory technology becomes AI bottleneck
High-bandwidth memory represents specialized DRAM stacked vertically and connected to processors, enabling dramatically faster data transfer rates compared to conventional memory architecture. As AI models grew larger and more complex throughout 2025, HBM became the critical bottleneck determining training speed and inference performance. NVIDIA’s latest GPU accelerators require HBM3 memory—Micron’s specialty product—creating supply constraints that persisted throughout the year.
Micron’s manufacturing expertise in advanced memory technologies positioned the company advantageously. While competitors struggled to scale HBM production, Micron ramped capacity aggressively, securing multi-year supply agreements with hyperscalers and AI hardware manufacturers. Revenue growth accelerated from single digits in early 2024 to 40%+ year-over-year growth rates by late 2025. Gross margins expanded dramatically as HBM commanded premium pricing compared to commodity DRAM products.
Investment lesson: Margin expansion signals durable competitive advantages
Micron’s performance demonstrates that margin expansion often matters more than revenue growth for semiconductor investors. Memory chips historically operated as commodity products with razor-thin margins determined by supply-demand cycles. When Micron began reporting gross margins exceeding 40%—substantially above historical norms—fundamental analysts recognized this reflected genuine competitive differentiation rather than temporary pricing power. Companies that sustain margin expansion while growing revenue typically deliver superior shareholder returns because profitability compounds faster than topline growth.
4. Palantir Technologies (PLTR): +142% YTD—Enterprise AI adoption reaches inflection point
Palantir Technologies gained 142% in 2025 as its Artificial Intelligence Platform (AIP) achieved commercial adoption inflection. The company’s US commercial revenue grew an astounding 93% year-over-year, demonstrating that enterprise AI spending had transitioned from experimental budgets to core operational investments.
Financial performance: Accelerating growth with expanding profitability
Palantir reported Q2 2025 results demonstrating exceptional fundamental strength: gross margin reached 80.8%, GAAP operating margin expanded to 27%, and GAAP net margin hit 32.6%. These profitability metrics—rare among high-growth software companies—indicated Palantir had achieved efficient scaling. The company maintained $6 billion in cash and US Treasuries with zero debt, providing a current ratio of approximately 6.3 and substantial financial flexibility.
The company raised full-year 2025 revenue guidance to $3.89-$3.90 billion, representing 44% growth. More impressively, US commercial revenue achieved a $1.6 billion run rate with 121% year-over-year growth driven by large enterprise contracts. Net revenue retention improved to 134%, signaling that existing customers were expanding their Palantir usage substantially—a key indicator of product-market fit and durable demand.
Valuation concerns: When fundamentals diverge from price
Despite strong fundamentals, Palantir’s valuation reached extreme levels by year-end 2025. The stock traded at approximately 136x forward 2027 earnings—vastly exceeding software industry averages. Analysts expressed concern that even if the company executes perfectly, achieving double-digit annualized returns from current prices requires extraordinary continued growth acceleration. This demonstrates a critical lesson: strong fundamentals don’t guarantee attractive investment returns when valuation already reflects perfection.
5. NRG Energy: +42% in May alone—Power infrastructure benefiting from AI demands
NRG Energy surged over 42% in May 2025, emerging as the top-performing S&P 500 stock that month. The Houston-based energy company benefited from a combination of strong earnings, strategic acquisitions, and positioning at the intersection of traditional power generation and emerging AI infrastructure power demands.
Strategic acquisition: Doubling generation capacity
NRG announced a $6.4 billion acquisition of LS Power’s “Premier Power” portfolio, which would double the company’s power generation capacity and add a 6 gigawatt virtual power plant business. This transaction positioned NRG to capitalize on surging electricity demand from data centers powering artificial intelligence workloads. The company posted first-quarter adjusted earnings of $2.62 per share—far exceeding analyst expectations—and reported $8.59 billion in revenue.
Management reaffirmed 2025 guidance and announced plans to return $1.3 billion to shareholders through dividends and buybacks. This combination—growth through acquisition, strong organic performance, and capital return to shareholders—created a compelling investment narrative that drove the May rally. The broader sector rebound in energy stocks further supported the performance.
Part II: The Catastrophic Losers—Five Stocks That Destroyed Shareholder Value
The worst-performing stocks of 2025 shared different characteristics: deteriorating fundamentals (rising costs, slowing growth), valuation compression (multiple contraction as growth slowed), leadership instability, or competitive pressures. Each loser demonstrates how fundamental weakness—ignored or dismissed during bullish periods—eventually manifests in severe price declines.
1. UnitedHealth Group (UNH): -44% YTD—Medicare cost crisis destroys industry leader
UnitedHealth Group suffered a devastating 44% decline in 2025, transforming from a reliable defensive healthcare stock into one of the year’s worst performers. The Minnetonka, Minnesota-based healthcare giant—operating through UnitedHealthcare (insurance) and Optum (services)—experienced fundamental deterioration that Wall Street had not anticipated.
The medical cost ratio explosion: 430 basis points of margin erosion
UnitedHealth’s medical care ratio surged to 89.4% in Q2 2025—a devastating 430 basis point deterioration from the prior year. This metric measures medical costs as a percentage of premium revenue; higher ratios indicate lower profitability. The 89.4% ratio compared unfavorably to the company’s historical 82% ratio maintained in 2022, demonstrating rapid margin compression.
The fundamental cause: healthcare utilization surged as Medicare Advantage patients—particularly seniors—sought deferred medical care accumulated during the pandemic. Medical severity increased as conditions worsened from delayed treatment. UnitedHealth had underestimated these trends when setting premium pricing, resulting in catastrophic losses as actual medical costs exceeded reserves. On April 17, 2025, the company reported its first earnings miss since 2008, sending shares plummeting.
Leadership crisis compounds operational challenges
On May 13, 2025, CEO Andrew Witty suddenly resigned citing “personal reasons,” creating leadership instability at a critical moment. His departure followed the December 2024 tragedy when UnitedHealthcare CEO Brian Thompson was killed, leaving the organization reeling from leadership losses. Stephen Hemsley, the company’s longtime chairman and former CEO, returned as interim CEO during the transition.
The company withdrew full-year 2025 guidance—a rare admission of uncertainty for a company known for predictable performance. Additionally, reports emerged of Department of Justice investigations into billing practices, adding regulatory risk to operational challenges. Multiple class-action lawsuits followed, alleging securities fraud and inadequate disclosure of deteriorating fundamentals.
Investment lesson: Margin deterioration as early warning signal
UnitedHealth’s collapse demonstrates that margin deterioration often signals fundamental business problems before they become obvious. Investors who monitored the medical cost ratio quarterly would have observed concerning trends in late 2024—rising utilization, increasing medical severity, inadequate premium adjustments. Those who recognized these early warnings could have avoided or minimized losses. Conversely, investors who focused solely on revenue growth or market position missed the profitability crisis developing beneath seemingly stable topline numbers.
2. Lululemon Athletica (LULU): -52% YTD—Premium athleisure loses pricing power
Lululemon plummeted 52% in 2025, falling from peak valuations above $500 per share to approximately $240 by year-end. The Vancouver-based athleisure pioneer—once considered immune to competitive pressure—experienced a perfect storm of consumer spending pressure, intensifying competition, and leadership transition uncertainty.
Fundamental deterioration: Same-store sales decline signals brand weakness
United States same-store sales—a critical metric measuring organic growth at existing locations—turned negative as consumers reduced discretionary spending on premium-priced activewear. Lululemon’s $100+ yoga pants and $70 sports bras, once considered essential purchases for affluent consumers, faced resistance as economic uncertainty grew. Customers traded down to lower-priced alternatives from Alo Yoga, Vuori, and private-label brands at Target and Amazon.
Competition intensified dramatically. Alo Yoga expanded aggressively into Lululemon’s core demographic with comparable quality at lower price points. Vuori gained market share in men’s activewear—a segment where Lululemon historically struggled. Mass retailers improved quality substantially, offering “good enough” alternatives at 50-60% discounts to Lululemon pricing. The company’s premium positioning—previously a competitive moat—became a liability in a more price-sensitive environment.
Leadership transition amplifies uncertainty
In January 2026, CEO Calvin McDonald announced his departure, creating succession uncertainty during a critical turnaround period. McDonald had led Lululemon since 2018, guiding the company through pandemic disruptions and international expansion. His exit raised questions about strategic direction and execution capability during challenging market conditions.
Elliott Investment validates fundamental value
On December 18, 2025, Elliott Investment Management disclosed a $1+ billion stake in Lululemon—one of the world’s most sophisticated activist investors signaling confidence in fundamental value at depressed prices. Elliott’s investment thesis presumably centers on operational improvements, margin recovery, and brand strength that remains intact despite near-term challenges. This validates that strong companies can become attractive investments when temporary problems create valuation opportunities.
3. Enphase Energy (ENPH): -47% YTD—Solar demand slowdown crushes growth expectations
Enphase Energy plummeted 47% in 2025 as residential solar installation demand decelerated sharply. The Fremont, California-based company manufactures microinverters—devices that convert solar panel DC electricity into AC power for home use—and experienced devastating revenue declines as high interest rates suppressed home improvement spending.
Interest rate sensitivity destroys growth narrative
Residential solar installations typically require financing—homeowners rarely pay cash for $20,000-$40,000 solar systems. When mortgage rates remained elevated above 6% throughout 2025, home equity lines of credit (HELOCs) and solar-specific loans became prohibitively expensive. Installation volume collapsed as consumers delayed discretionary home improvement projects. Enphase’s revenue declined sequentially for multiple quarters as installer customers reduced inventory orders.
Additionally, net metering policies—regulations requiring utilities to purchase excess solar generation at retail rates—faced rollbacks in several states. California, Enphase’s largest market, implemented NEM 3.0 regulations that substantially reduced solar economics for new installations. These policy headwinds compounded interest rate pressures, creating a perfect storm for demand destruction.
Investment lesson: Understanding macroeconomic sensitivity
Enphase demonstrates the importance of assessing business model sensitivity to macroeconomic variables. Companies dependent on consumer financing—solar, homebuilders, automotive—face cyclical headwinds when interest rates rise. Investors who recognized Enphase’s fundamental exposure to financing costs could have anticipated revenue pressure when the Federal Reserve maintained restrictive monetary policy. This analytical framework applies broadly: always identify which macroeconomic variables most influence a company’s demand environment.
4. CVS Health (CVS): Operational struggles and leadership turnover
CVS Health experienced significant declines throughout 2025, facing many of the same Medicare cost pressures affecting UnitedHealth. The company’s integrated model—combining retail pharmacies, pharmacy benefit management (Caremark), and health insurance (Aetna)—faced strain across all three segments simultaneously.
Multiple business model challenges converge
Retail pharmacy margins compressed as reimbursement rates declined and generic drug deflation persisted. The Aetna insurance business experienced medical cost ratio expansion similar to UnitedHealth, though less severe. Caremark faced competitive pressure from Amazon Pharmacy and Mark Cuban’s Cost Plus Drugs, which offered transparent pricing models threatening traditional PBM economics. Management underwent multiple changes, creating strategic uncertainty and execution challenges.
5. Dollar Tree (DLTR): Value retail faces margin compression and competitive pressure
Dollar Tree struggled throughout 2025 as its fixed-price business model faced cost inflation pressure. The company operates two retail formats: Dollar Tree stores (everything $1.25) and Family Dollar stores (varied pricing). Both formats experienced challenges as input cost inflation exceeded pricing flexibility, compressing margins substantially.
The fixed-price trap: When inflation destroys unit economics
Dollar Tree’s historical $1.00 price point provided strong brand identity but created vulnerability during inflationary periods. After raising prices to $1.25 in 2021-2022, the company faced renewed pressure as product costs, freight expenses, and labor wages continued rising. Unlike retailers with dynamic pricing, Dollar Tree couldn’t adjust prices incrementally—each price change required complete store reformatting and represented a significant brand risk.
Family Dollar faced separate challenges: intense competition from Dollar General, Walmart, and Amazon; store base requiring substantial capital investment for modernization; and inventory management issues creating margin pressure. The combined effect—Dollar Tree format constrained by pricing rigidity, Family Dollar struggling competitively—created fundamental deterioration across the enterprise.
Critical Lessons: What Fundamental Analysis Teaches About Market Winners and Losers
Analyzing 2025’s extreme performers reveals consistent patterns that fundamental analysis can identify. These patterns apply across market cycles and provide frameworks for evaluating investments in 2026 and beyond.
Lesson 1: Margin trends predict outcomes better than revenue growth
Winners (Micron, Palantir, Seagate) demonstrated expanding gross and operating margins—indicating pricing power, operational efficiency, or competitive advantages. Losers (UnitedHealth, CVS, Dollar Tree) experienced margin compression—signaling cost pressure, competitive weakness, or business model challenges. Monitoring quarterly margin trends provides early warning signals before problems become obvious.
Lesson 2: Supply-constrained businesses deliver exceptional returns
Seagate and Micron benefited from genuine supply shortages in critical technology inputs (data storage, high-bandwidth memory). When demand exceeds available supply, companies command premium pricing and achieve exceptional profitability. Identifying supply-constrained situations before they become obvious creates asymmetric return opportunities. Ask: “Where is demand growing faster than supply can expand?”
Lesson 3: Valuation matters—even for high-quality businesses
Palantir demonstrated exceptional fundamental performance yet faced valuation concerns at 136x forward earnings. Lululemon possessed strong brand equity but delivered negative returns when purchased at peak valuations above 40x earnings. The lesson: strong companies can be poor investments at wrong prices. Always assess whether current valuation reflects achievable future performance or requires perfection.
Lesson 4: Understand macroeconomic sensitivities
Enphase Energy’s decline stemmed from interest rate sensitivity—a macroeconomic variable outside management control. Companies dependent on consumer financing, discretionary spending, or cyclical demand face headwinds when macroeconomic conditions deteriorate. Investors must assess: “Which macroeconomic variables most influence this business? What happens if those variables move adversely?”
Lesson 5: Leadership stability matters during challenging periods
UnitedHealth and Lululemon both experienced CEO departures during critical periods, amplifying uncertainty and investor anxiety. Stable, experienced leadership provides confidence that companies can navigate challenges effectively. Leadership transitions during crises create additional risk premium that fundamental analysis must account for.
Looking Forward: Applying These Lessons to 2026 Investment Decisions
For students developing analytical skills and professionals refining investment processes, 2025’s extreme performers provide valuable case studies. The winners demonstrated that identifying structural growth trends early (AI infrastructure), finding supply-constrained opportunities (HBM memory, data storage), and recognizing margin expansion create pathways to exceptional returns.
The losers illustrated that margin deterioration signals fundamental weakness, valuation matters regardless of quality, macroeconomic headwinds destroy leveraged business models, and leadership stability during transitions affects execution capability. These lessons apply universally—the specific stocks change, but the fundamental patterns persist.
The central insight: Fundamental analysis—examining revenue growth, profitability trends, competitive positioning, valuation metrics, and macroeconomic sensitivity—provides superior investment outcomes compared to momentum trading, technical analysis, or narrative-driven speculation. Markets ultimately reflect business fundamentals, though timing can be unpredictable in the short term.
Sources & References
- The Motley Fool (2025) — These 5 S&P 500 Stocks Are Up by More than 200% in 2025
- BBAE (2025) — S&P 500: The Winners and Losers of May 2025
- IO Fund (2025) — Palantir Stock Forecast 2025: Can PLTR Justify Its High Valuation?
- RoboForex (2025) — Palantir Technologies Inc. (PLTR) stock analysis and forecast for 2025
- Seeking Alpha (2025) — Palantir: When Solid Fundamentals Are Not Enough
- Yahoo Finance (2025) — UNH Stock is Down 44% in 2025, But This Analyst Still Thinks UnitedHealth is a Top Q2 Earnings Pick
- Trefis (2025) — UnitedHealth Stock’s Freefall From $600 To $250: Where Does This End?
- TIKR (2025) — Is UnitedHealth Group Stock Undervalued in 2025? Complete UNH Analysis
- Bloomberg (2025) — Elliott Builds $1 Billion-Plus Stake in Lululemon
- Simply Wall St — Palantir Technologies Stock Analysis
- Simply Wall St — UnitedHealth Group Stock Analysis
Subscribe to Aniketh Focus for weekly fundamental analysis, market insights, and investment education helping students and professionals develop analytical skills for long-term investing success.