⚠️ EDUCATIONAL CONTENT ONLY: This article provides educational market analysis and does not constitute financial, investment, or legal advice. The content is for informational purposes only. Always consult qualified financial professionals before making investment decisions. Investing involves risk, including possible loss of principal.
Gold hit $4,400 and silver surged 134% in 2025. Discover what triggered the sudden price spikes, why analysts see silver reaching $100 in 2026, and which mining stocks offer leveraged exposure for client portfolios.
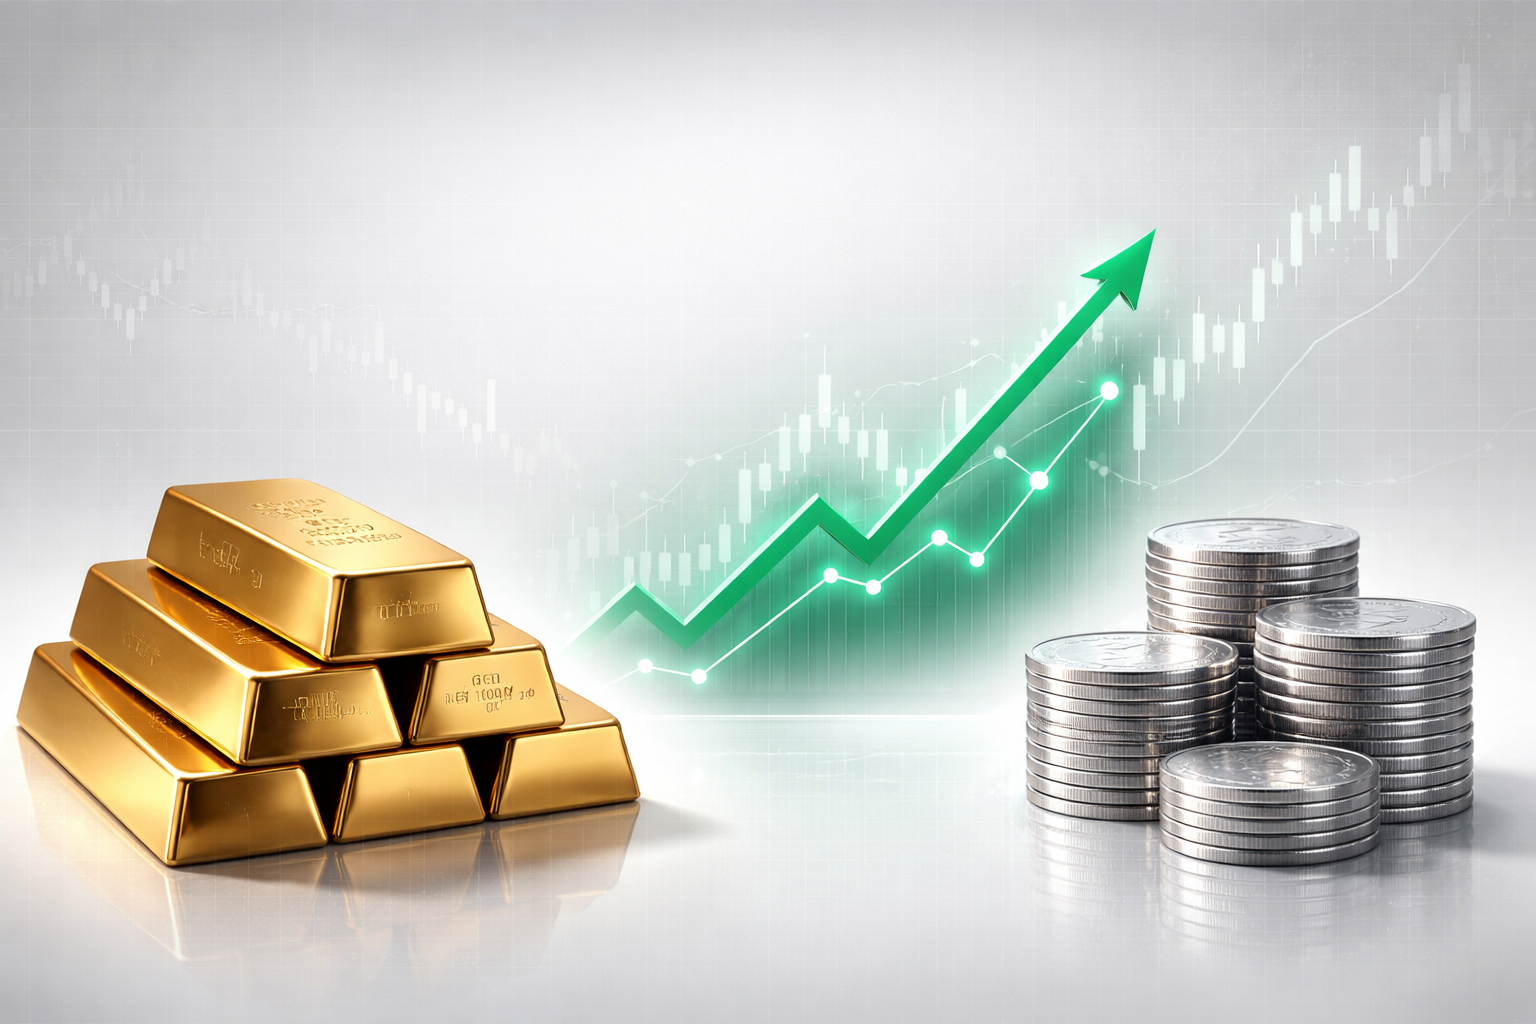
The precious metals market delivered one of its most dramatic performances in modern history during 2025, catching even seasoned wealth advisors off guard. Gold surged past $4,400 per ounce in late December, representing a 70% gain for the year and marking its best annual performance since 1979. But the real story unfolded in silver, which exploded from roughly $28 at the start of the year to over $75 by year-end—a staggering 134% increase that shattered the metal’s previous all-time high set in 1980.
For wealth advisors managing client portfolios, these weren’t gradual, predictable moves. Gold and silver prices hitting record highs represented sudden, violent repricing events that demanded immediate attention. The question wealth managers now face isn’t whether these gains were justified—the market has already answered that. The critical question for 2026 is whether this represents a sustainable shift or a speculative peak, and more importantly, which investment vehicles offer the best risk-adjusted exposure for sophisticated investors.
Note: Monthly progression is illustrative based on reported annual performance data from market sources.
The gold price spike 2025: Four catalysts converged
Understanding the gold and silver price spike 2025 requires examining the unprecedented convergence of macroeconomic forces that created what analysts are calling a "perfect storm" for precious metals. Unlike previous bull markets driven primarily by inflation fears or geopolitical crises, the 2025 surge reflected multiple structural shifts occurring simultaneously.
Central bank buying reached historic proportions
The most significant structural driver behind the gold and silver price spike was central bank accumulation at levels not seen in decades. According to JPMorgan Global Research, central banks purchased over 1,000 tonnes of gold in each of the last three years, more than double the 400-500 tonne annual average observed across the previous decade. This wasn't scattered buying from minor players. Major economies including China, Russia, and Turkey systematically increased their gold reserves as a percentage of total holdings, with global central bank gold reserves climbing from approximately fifteen percent of official reserves at the end of 2023 to nearly twenty percent by late 2024.
Source: JPMorgan Global Research central bank demand data, 2015-2025.
The motivation behind this accumulation reveals a fundamental shift in global monetary architecture. Following the freezing of Russian sovereign reserves in 2022, numerous countries recognized the geopolitical risk of holding excessive dollar-denominated assets. JPMorgan analysts project central bank demand will average 585 tonnes per quarter in 2026, maintaining elevated buying pressure even at current elevated prices. For wealth advisors, this represents a crucial distinction from investor-driven rallies—central banks exhibit price-insensitive buying patterns when pursuing strategic diversification, providing a structural bid beneath the market.
Dollar devaluation created the worst crisis in fifty years
The U.S. dollar experienced its most severe depreciation in half a century during 2025, with the dollar's value against other currencies plunging approximately eleven percent over the first half of the year according to Morgan Stanley analysis. This represented the sharpest six-month decline since the 1970s inflation crisis, undermining the dollar's traditional role as the global reserve currency anchor.
The dollar weakness wasn't merely a technical currency fluctuation. It reflected fundamental concerns about U.S. fiscal policy, with mounting federal deficits and political pressure on Federal Reserve independence raising questions about long-term dollar stability. For international investors, a weaker dollar makes gold more affordable in local currency terms, but more importantly, it validates gold's role as a monetary alternative when confidence in fiat currencies deteriorates. Currency Composition of Official Foreign Exchange Reserves data from the International Monetary Fund documented accelerating diversification away from dollar holdings, with gold becoming the preferred alternative for central banks seeking to reduce dollar exposure without embracing competing fiat currencies.
Economic uncertainty reached COVID-era levels
Research from Tufts University economists analyzing gold price determinants identified global economic uncertainty as the primary statistical driver behind the 2025 surge. Their systematic empirical analysis covering the period from 2003 through early 2025 revealed that the global policy uncertainty index rose from relatively normal levels in early 2024 to heights comparable to the peak of the COVID pandemic by late 2024 and early 2025.
The specific catalyst centered on trade policy uncertainty, with the massive spike in tariff-related anxiety following November 2024 elections creating widespread concern about inflation impacts, global supply chain disruption, and potential geopolitical retaliation. Market commentary suggested that threats of substantial tariff increases on major U.S. trading partners generated the kind of systemic uncertainty that historically drives investors toward safe-haven assets. The researchers concluded that this uncertainty factor explained the majority of gold's price appreciation during the period, with rising inflation expectations contributing a modest six percent to the overall move.
Federal Reserve rate cuts enhanced precious metal appeal
The Federal Reserve's pivot toward monetary easing provided the final piece of the puzzle. Gold prices surged as the Federal Reserve cut interest rates during the latter part of 2025, with expectations of additional cuts in 2026 supporting continued upward momentum. The relationship between interest rates and gold prices follows straightforward logic: gold generates no income, making it less attractive when bonds offer high yields. As the Fed reduced rates and bond yields fell accordingly, the opportunity cost of holding non-yielding gold diminished substantially.
JPMorgan analysts projected that gold prices could push toward five thousand dollars per ounce by the fourth quarter of 2026, with six thousand dollars per ounce possible longer term, driven in part by expectations that the Fed would continue cutting rates. This monetary easing environment created favorable conditions for precious metals to appreciate against fiat currencies whose purchasing power eroded through deliberate central bank policy.
Why silver's spike exceeded gold by nearly double
While gold's seventy percent gain captured headlines, silver's 134-150% surge represented the real story for sophisticated investors seeking alpha generation. The divergence between gold and silver performance in 2025 wasn't random market noise—it reflected fundamental supply-demand dynamics that may persist and intensify throughout 2026.
The fifth consecutive year of structural supply deficit
According to comprehensive research from Crux Investor analyzing silver market fundamentals, the global silver market experienced its fifth consecutive annual supply deficit in 2025, with the cumulative shortfall from 2021 through 2025 totaling approximately 820 million ounces—equivalent to an entire year of average global mine production. The Silver Institute projected a market deficit of 117.6 to 149 million ounces for 2025 specifically, representing a significant gap between production and consumption that inventories could no longer sustainably fill.
Source: Silver Institute annual supply-demand data, Crux Investor market analysis.
The supply constraints extended beyond simple production shortfalls. London Bullion Market Association vaults, traditionally holding vast silver reserves, experienced dramatic depletion. In June 2022, London vaults contained 31,023 metric tons of silver. By March 2025, volumes had fallen by approximately one-third to 22,126 metric tons—the lowest point in years. The physical shortage became so acute that in October 2025, traders faced lease rates reaching 200 percent on an annualized basis for overnight silver borrowing, as market participants scrambled to close positions against vanishingly available metal. Some traders reportedly resorted to transporting silver by air freight rather than cargo ships to meet urgent delivery demands.
Industrial demand explosion: solar, EVs, and AI infrastructure
Silver's dual identity as both a precious metal and critical industrial commodity created unique demand dynamics completely absent from gold. Research from the Silver Institute and Oxford Economics documented that global industrial silver demand reached a record 680.5 million ounces in 2024, with projections showing continued growth across key technology sectors through 2030.
Source: Silver Institute/Oxford Economics industrial demand forecast, BMO Capital Markets solar sector analysis.
The solar photovoltaic sector emerged as perhaps the single largest driver. BMO Capital Markets estimated that silver demand in solar applications would reach 261 million ounces in 2025, marking a 5.5 percent increase from the previous year. More strikingly, analysts projected that the solar industry alone could cumulatively demand 85-90 percent of today's known silver reserves by 2050 if present growth rates continue. China's ten billion dollar subsidy package for solar panel manufacturers announced in 2025 was expected to boost silver consumption by approximately five percent over the following twelve months. The European Union's goal of delivering at least 700 gigawatts of solar capacity by 2030 would further accelerate silver consumption.
Electric vehicle production created parallel demand growth. Each battery electric vehicle consumes on average 67-79 percent more silver than traditional internal combustion engine vehicles, with approximately 25-50 grams of silver per EV used in battery management systems, power electronics, charging infrastructure, and electrical contacts. The Oxford Economics report forecasted global automotive silver demand would increase at a compound annual growth rate of 3.4 percent between 2025 and 2031, with EVs projected to overtake internal combustion vehicles as the primary source of automotive silver demand by 2027 and account for 59 percent of the market by 2031.
The artificial intelligence infrastructure buildout added unexpected demand pressure. Data centers providing the physical infrastructure for cloud computing and AI systems experienced a 5,252 percent increase in global IT power capacity from 2000 to 2025, jumping from 0.93 gigawatts to nearly 50 gigawatts. This massive expansion in computing hardware translated directly into greater silver demand given the metal's irreplaceable properties in high-performance electronics and thermal management systems.
China's export controls tighten supply further
China's announcement of new silver export controls starting January 1, 2026 created immediate market anxiety about future supply availability. The new rules require companies to secure government licenses to export silver, with eligibility limited to state-approved firms producing at least 80 tonnes annually and holding thirty million dollars in credit lines. This regulatory framework effectively blocks small and mid-sized exporters from international markets, reducing global supply availability almost overnight.
China controls 60-70 percent of the world's silver output, making these export restrictions particularly significant. Combined with global silver supply standing at approximately one billion ounces according to Statista data, and annual supply deficits of 115-120 million ounces straining inventories for the fifth consecutive year, the Chinese policy shift threatened to exacerbate an already tight market. For wealth advisors, this represents a geopolitical supply risk completely absent from gold markets, where production remains more geographically dispersed.
Why analysts see silver reaching $100 in 2026
Professional forecasters are projecting that silver could outperform gold substantially in 2026, with several fundamental factors supporting triple-digit price targets that would have seemed absurd just two years ago.
Gold-silver ratio signals major catch-up potential
The gold-silver ratio—measuring how many ounces of silver equal the price of one ounce of gold—provides crucial insight into relative valuation. Technical analysis from FX Empire showed the ratio declining from over 104-to-1 in April to approximately 64-to-1 by late December, indicating silver's accelerating momentum relative to gold. However, this ratio remains elevated compared to the long-term historical average, which typically sits closer to 60-to-1 or even lower during previous precious metals bull markets.
Source: FX Empire technical analysis. Note: Monthly progression is illustrative based on reported April peak (104:1) and December (64:1) data points.
Multiple analysts projected further ratio compression toward 60-to-1 or lower by the end of 2026. If gold simply maintains current levels around forty-five hundred dollars per ounce while the ratio normalizes to 60-to-1, silver would trade at seventy-five dollars. If gold advances toward JPMorgan's five thousand dollar target and the ratio compresses to 50-to-1—not unprecedented during bull markets—silver would reach one hundred dollars per ounce. The mathematical relationship creates scenarios where silver could deliver substantially higher percentage gains than gold simply through mean reversion in relative valuation.
Expert price targets cluster around $70-$100
Professional forecasters established a consensus range for silver in 2026 between sixty-five and one hundred dollars per ounce, with some aggressive outliers reaching toward two hundred dollars. CBS News surveyed precious metals investment experts who widely expected silver price increases to continue into 2026, driven by rising economic uncertainty and continued inflation above the Federal Reserve's two percent target.
GoldSilver's lead analyst Alan Hibbard projected silver would trade above one hundred dollars in 2026 as supply deficits deepen and industrial demand accelerates. The rationale centered on structural scarcity rather than speculative momentum—once seventy dollars becomes the clearing price for physical industrial demand, the market tends to attract buyers on weakness rather than sellers on strength. Industrial consumers proved relatively price-insensitive in the short term given silver's small percentage of total manufacturing costs, even as its functional properties remain irreplaceable in many applications.
Mining stocks as leveraged plays on metal prices
For wealth advisors constructing client portfolios with precious metals exposure, mining stocks offer potential leverage to metal price movements that physical holdings cannot match. The 2025 performance data validated this thesis dramatically, with major miners delivering returns that significantly exceeded the underlying metals' appreciation.
Gold miners: Operational leverage in action
Analysis from Stocktwits tracking large-cap mining performance revealed that Newmont Corporation, the world's largest gold miner, jumped over 167 percent in 2025—more than double gold's seventy percent gain. Barrick Mining, which dropped the word "gold" from its name during the year to reflect diversification into copper, saw shares soar 182 percent, marking the company's biggest yearly gains since its 1987 listing on the New York Stock Exchange. Agnico Eagle Mines surged 116 percent, while Franco-Nevada, operating under a royalty and streaming model rather than direct mining, reported record quarterly revenue of $487.7 million in the third quarter, representing a 77 percent increase year-over-year.
Source: Stocktwits, Zacks Investment Research, U.S. News - reported 2025 total returns and company-specific performance data.
The operational leverage concept explains this outperformance. Mining companies face relatively fixed costs for extraction, processing, and administration. When gold prices increase, revenue rises while costs remain largely stable, causing profit margins to expand dramatically. For example, Newmont's average realized gold price jumped to $3,539 per ounce in the third quarter of 2025 from $2,518 per ounce a year earlier—a 40 percent increase. With all-in sustaining costs around $1,566 per ounce, this price appreciation flowed almost entirely to the bottom line, creating outsized earnings growth that drove stock performance well beyond the metal's price gain.
Franco-Nevada presented a particularly attractive risk-reward profile for conservative wealth managers. The company's streaming and royalty model eliminates direct operational risks—it provides upfront capital to miners in exchange for rights to purchase future production at fixed discounted prices or receive revenue percentages. This business model enabled Franco-Nevada to maintain a completely debt-free balance sheet with approximately $1.4 billion in available capital for new investments as of late 2025. The company raised its dividend for 18 consecutive years through 2025, providing income alongside capital appreciation. Analysts from UBS raised their price target to $270 from $260 in December, maintaining a "buy" rating with shares trading around $203, implying over 30 percent upside potential.
Silver miners: Higher beta with fundamental support
Silver mining stocks delivered even more dramatic leverage to the underlying metal's performance. Zacks Investment Research analysis of silver miners showed First Majestic Silver gaining 162 percent in 2025, bolstered by its acquisition of Gatos Silver which provided a 70 percent interest in the high-quality Cerro Los Gatos underground mine. Pan American Silver, billing itself as the world's premier silver mining company, posted 119 percent gains while maintaining a 2.0 percent dividend yield and strong balance sheet fundamentals including a current ratio of 2.5 times and debt-to-equity ratio of just 17.6 percent.
The consensus earnings estimates for these companies reflected dramatic growth projections. First Majestic's estimates for 2025 and 2026 indicated year-over-year growth of 279 percent and 37 percent respectively, with both estimates revised upward in the preceding 60 days as analysts incorporated stronger silver prices and operational improvements. Pan American Silver's 2026 guidance for silver production reached 22-22.5 million ounces, up from previous forecasts, with the company's La Colorada Skarn project advancing toward a preliminary economic assessment in 2026 that could further expand production capacity.
Wheaton Precious Metals offered a lower-risk silver exposure through its streaming business model. The company held contractual rights through 2029 to purchase silver at an average price of $5.75 per ounce—meaning any silver price above that level generated pure profit margin. With silver trading above $75 by year-end 2025, Wheaton enjoyed margins exceeding $69 per ounce on its silver streams. The company's progressive dividend policy of paying out 25 percent of cash flow meant shareholders participated directly in the windfall from elevated prices.
Investment thesis for wealth advisors
The gold and silver price spike 2025 created both opportunities and risks for client portfolios entering 2026. Wealth advisors must balance the compelling fundamental case for continued precious metals strength against valuation concerns and execution risks inherent in mining operations.
The structural case for gold remains robust. Central bank buying shows no signs of abating, with JPMorgan projecting sustained demand averaging 585 tonnes per quarter through 2026. Dollar weakness and fiscal concerns persist regardless of short-term policy adjustments. Geopolitical tensions from Ukraine to the Middle East to potential trade wars provide ongoing safe-haven demand. Federal Reserve rate cuts enhance gold's relative attractiveness versus bonds. These factors suggest gold's move toward five thousand dollars or higher represents fundamental repricing rather than speculative excess.
Silver presents an even more compelling but higher-risk proposition. The five-year supply deficit shows no signs of resolution, with industrial demand from solar, EVs, and AI infrastructure accelerating faster than new mine development. China's export controls tighten physical availability precisely when demand surges. The gold-silver ratio suggests significant catch-up potential even without further gold appreciation. Analyst targets clustering around seventy to one hundred dollars appear conservative given structural dynamics.
For portfolio implementation, mining stocks offer leveraged exposure but require careful selection. Senior producers like Newmont and Barrick provide stability through diversified operations and strong balance sheets. Franco-Nevada and Wheaton Precious Metals eliminate operational risk through streaming models while maintaining dividend growth. Silver miners like Pan American and First Majestic offer higher beta with fundamental support from acquisition-driven growth and expanding production. The historical pattern shows mining stocks delivering two to three times the underlying metal's returns during sustained bull markets—a relationship that held through 2025 and may persist into 2026.
The risks deserve equal consideration. Mining operations face execution challenges, cost overruns, regulatory hurdles, and geopolitical threats that physical metals avoid. An economic slowdown could crush industrial silver demand even as investment demand for gold remains strong. If the Federal Reserve reverses course and raises rates in response to inflation surprises, precious metals could face headwinds. Valuation metrics for many miners appear stretched after the 2025 run, limiting margin of safety.
The fundamental question for 2026 isn't whether precious metals deserve portfolio allocation—the structural drivers appear intact. The question is whether investors can stomach the volatility inherent in capturing returns from assets that doubled in a single year. For wealth advisors managing client expectations, the answer likely involves position sizing that reflects both opportunity and uncertainty. A measured allocation to quality miners and streaming companies may offer the optimal balance between participating in potential continued strength while maintaining risk management discipline appropriate for fiduciary responsibility.
⚠️ IMPORTANT REMINDER: This analysis is provided for educational purposes only and does not constitute financial, investment, or legal advice. Precious metals and mining stocks involve substantial risk, including possible loss of principal. Past performance does not guarantee future results. The companies mentioned are for illustrative purposes only and should not be considered recommendations. Wealth advisors should conduct independent due diligence and consider client-specific circumstances before implementing any investment strategy. Always consult qualified financial professionals before making investment decisions.
Sources & References
- JPMorgan Global Research: Gold Price Outlook and Central Bank Demand Analysis
- ABC News: Why Gold and Silver Prices Are Hitting Record Highs
- Marketplace: Analysis of Gold's All-Time High Price Drivers
- Econofact/Tufts University: Empirical Analysis of Gold Price Determinants
- CNN Business: Gold's Best Year Since 1979 - Federal Reserve Impact
- CNBC: Silver Hit Record Highs - Supply Deficit Analysis
- Silver Institute/Oxford Economics: Industrial Demand Forecast Through 2030
- Industrial Silver Demand Analysis: Solar, EVs, and Semiconductors
- Investing.com: Three Key Factors Driving Silver Rally
- The Street: China Export Controls and Silver Supply Shock
- Crux Investor: Silver Market Fundamentals and Supply Deficit Analysis
- Stocktwits: Top Performing Large-Cap Mining Stocks 2025
- U.S. News: Best Gold Stocks for 2026 - Franco-Nevada, Newmont, Barrick Analysis
- Zacks Investment Research: Silver Stocks Analysis - Pan American, First Majestic, Hecla
- TipRanks: Silver Miners Positioned for 2026 Supply Tightness
- FX Empire: Silver Price Forecast - $100 Target Analysis for 2026
- CBS News: Expert Silver Price Forecasts for 2026
- CBS News: Will Silver Outpace Gold in 2026? Expert Analysis
- Motley Fool: Gold Mining Stocks Investment Guide
- Motley Fool: Best Silver Stocks - Wheaton, Pan American, First Majestic
Subscribe to Aniketh Focus for data-driven analysis of market trends, investment strategies, and portfolio insights for wealth advisors and financial professionals.